Infographics are widely applied for multiple purposes today and there are different type of infographics. This article will take you through everything you should know about infographics. You’ll find the different types of infographics, including some of the best resources to download infographic templates. Continue reading to find out more about infographics.
What Are Infographics
The main reason why people use infographics is because of the significant role it plays in making content rank well and be more understandable.
Definition of Infographics
As mentioned earlier, infographics are graphical designs that are created by using images, diagrams, charts, and graphs. Infographics are designed to work on the ability of the human visual to easily identify trends and patterns. Reading a text can be time-consuming, but studying images is a lot easier and more comprehensible.
Basically, infographics are designed to make data easier to digest visually, as they provide a more concise presentation of information.
Pros and Cons of Infographics
Here are the pros and cons of infographics that you should know:
Pros of Infographics
Infographics Simplify Complex Information: The main benefit of infographics lies in their ability to make complex information a lot easy to understand. This is because of the visual presentation of information in an appealing manner. With that, you won’t be looking at a bunch of text information, but you’ll be looking at graphical elements.
Infographics Increase Engagement and Reach: Whether it’s a stunning visual or only an idea, people find it easier to share infographics. This implies that it has a higher potential to reach more people within a short timeframe.
Infographics Increases Search Engine Rank: If you’re looking for a way to increase your ranking on search engines, you should consider using infographics to boost content. Using infographics also creates an opportunity for you to use your target keywords in descriptions, tags, and titles.
Information in Infographics is Easy to Retain: Studies show that it’s a lot easier to retain visual information than text information. In general, people remember more than 65% of the visuals they see for up to three days, but only 20% are able to remember textual information.
Cons of Infographics
While there are many advantages of infographics, there are also a couple of disadvantages, and here are some of them:
Infographics Can Be Expensive to Create: A lot of people will tell you that you can easily use freelance platforms to get cheap infographics. However, if you want a high-quality infographic, you should be prepared to spend more.
Infographics Can Be Time Consuming to Design: Even though infographics contain concise information, designing them requires time for research, design, and writing to ensure effective communication in the infographic.
It’s Easy to Misinterpret Infographics: If an infographic is not properly designed, it can be difficult to understand and also cause confusion.
How to Create Infographics
Here are tips for infographic design if you want to design high-quality infographics:
Define a Purpose
The infographic template you should have a clearly defined purpose even before you begin the design process. This should convey the message you want to give to your audience. Also, it’s easier to measure the success of the infographic once the purpose has been defined.
Study the Target Audience
After defining a purpose, the next thing is to understand the target audience. This is one of the main factors that influence the layout of the infographic. When studying your audience, some of the main factors to pay attention to include gender, profile age, interest, and social status. These factors will influence the layout, writing, and tone of the infographics.
Collect Information
Infographics are designed to pass information effectively. With that, when designing an infographic, you need to pay attention to the data you collect and ensure that they are accurate. Sometimes it’s advisable to contact an expert to help with the data collection.
Design
This is the part where you unleash your creative side. When you start the design process, the key thing to have in mind is how you can effectively communicate the information contained in the infographic. The bottom line is for the infographic design to be in line with the information you want to communicate.
Wireframe
After finalizing the layout, you can now start wireframing the design. This is basically a rough infographic layout that has the actual dimension of the infographic. The importance of this is that it makes it easier for you to determine the position of the texts on the infographic design.
Choose a Color Palette
Another important component of the layout is the color palette you choose. This factor can make or break your infographic template. Colors play a vital role in determining how your audience will perceive the infographic information.
Pick Charts and Graphs
If you’re presenting statistical or numeric data, you’ll need to include graphs or charts in the design. For this, it’s important that you choose the right graphs or charts according to the information you want to present.
Choose the Right Font
Another key thing to ensure is that you choose the right font for your infographic. For this, you need to ensure that the font you choose is readable.
Use the Right Images
The next thing you want to ensure is that all the illustrations, vectors, graphics, and other elements you use for the infographic design are ideal. When it comes to the images you use on your infographics, you have so many options, and as such, it’s best to choose carefully.
Regardless of the type of infographic you create, these are the most important steps to follow. The final thing you want to ensure is that you effectively promote the infographic. With this, you can be sure to create great infographics, irrespective of the type of infographic.
10 Types of Infographics
When you start designing your infographic, you’ll find that there are different types of infographics, and each has its own unique features. Here are 10 different types of infographics that you should know:
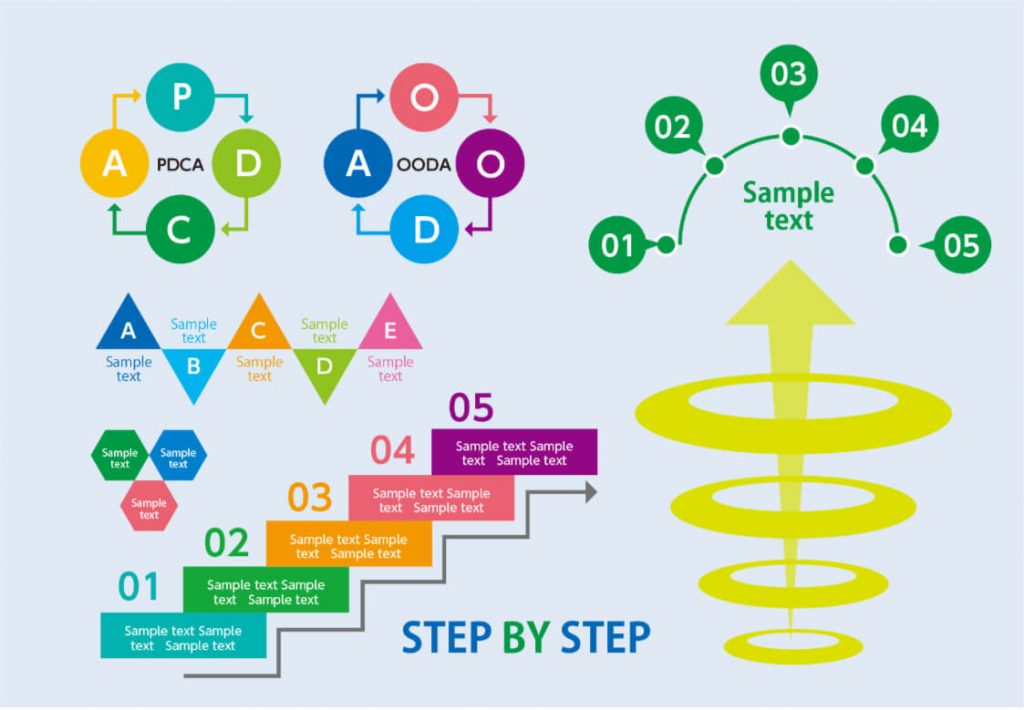
1. Timeline Infographic
The goal of this type of infographic is to plan for an event, share a story in chronological order, visualize data, take the audience on a journey, and highlight a sequence of events. Basically, with a timeline infographic, you can easily demonstrate the origin of an idea, story, or project.
If you plan to create this type of infographic, here’s how you can make it stand out:
Lay emphasis on main points by using different font sizes, and contrasting colors
Use icons to illustrate key points
Connect points with a line
Use appropriate labels
2. Process Infographic
Another type of infographic that you can create is the process infographic, and with this type, you can easily visualize a procedure, provide a brief step in a process, and also break down complex processes. With this type of infographic, you can make it easier for your audience to remember the processes in a procedure.
Here are key things to make your process infographic stand out:
Use different colors for each step
Use numbers, arrows, or lines to indicate the next step
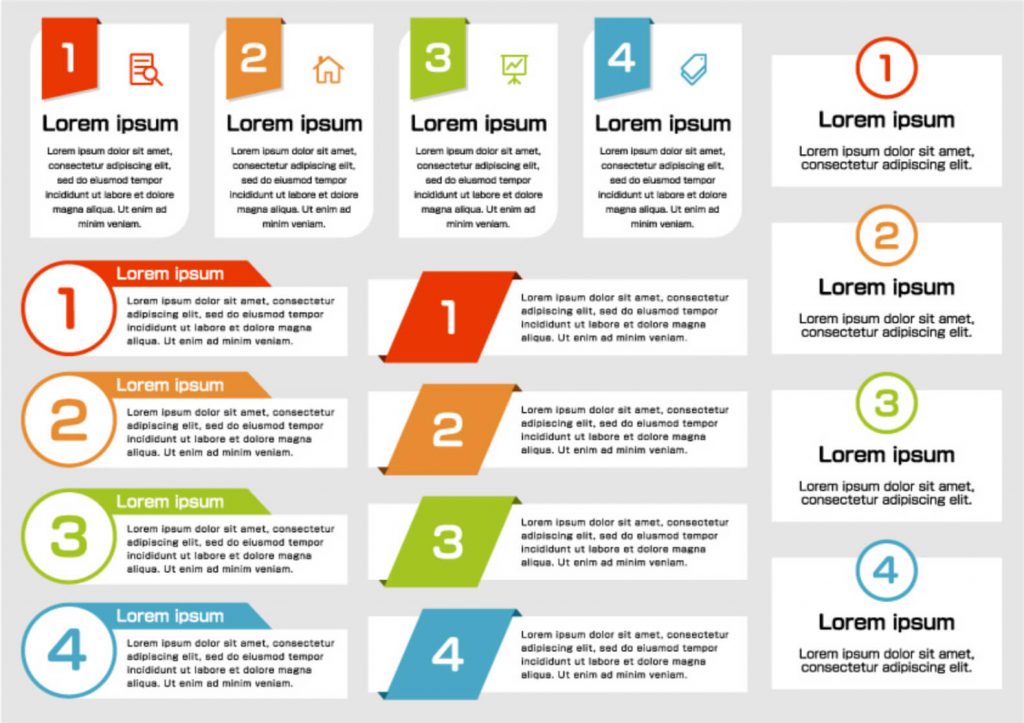
3. Informational Infographic
The informational infographic remains one of the most popular types of infographics. This type of infographic is the best option for anyone who wants to introduce a new concept or idea, share an overview of a topic, or even to make an article or blog post engaging.
Here are some best practices to help you create the best informational infographics:
Use a descriptive header and infographics to introduce the main points
Limit your color palette to five colors or less.
4. Map Infographic
This is the best type of infographic for looking to share location-based information or demographic data. Map infographic makes it easy to share visual stories of a place, illustrate trends in a region, and also communicate survey results.
To create outstanding map infographics, here are some tips to help you:
Avoid clutter by using more labels
Pay attention to information like the scale bar, data source, and map legend
5. Resume Infographic
People also call this type of infographic a visual resume because it makes it easier for job seekers to visualize their CVs. This is an ideal option to use if you want to catch the eye of recruiters, stand out among other candidates, and showcase your resume uniquely.
Here are tips to help you create an outstanding resume infographic:
Visualize skills and career history through charts, pictograms, and timelines
Choose icons, colors, and fonts according to your personality
Keep vital information at the top of the infographic resume
6. List Infographic
The human brain appreciates lists a lot, and this is another reason why infographics have become so popular. A list infographic is a type of infographic that’s great if you want to share a collection of tips, summarize your presentation, or support a topic with key points.
To make your list infographic stand out, here’s what you should do:
Use icons to replace bullet points
Make the main points stand out
Keep your list as short as possible
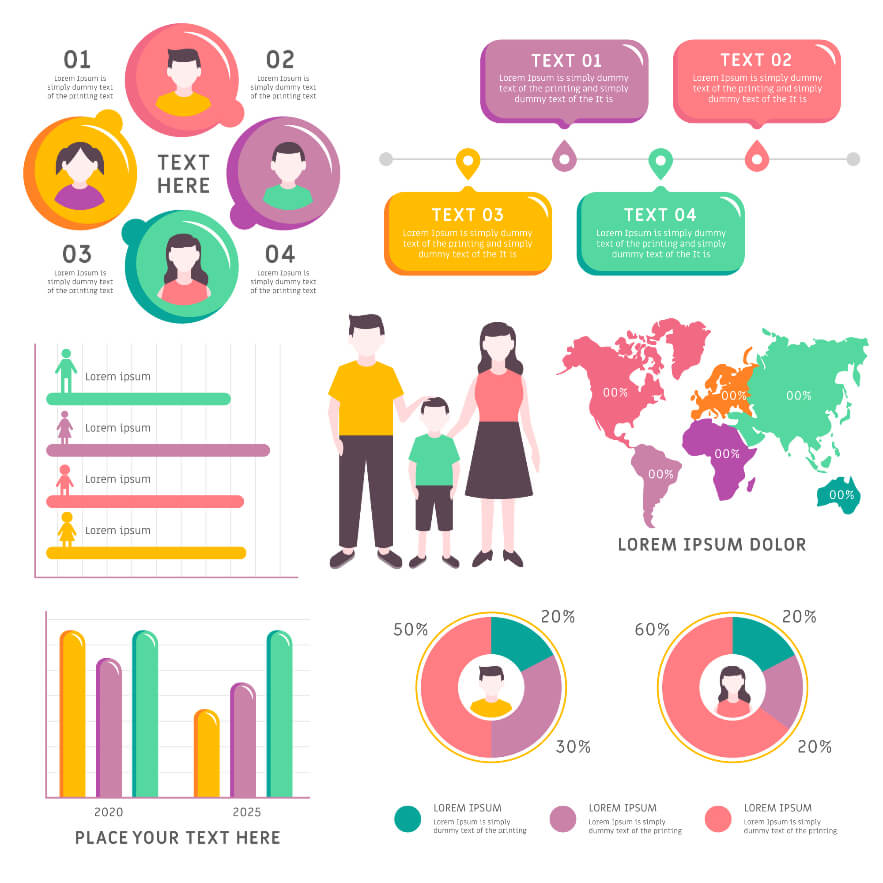
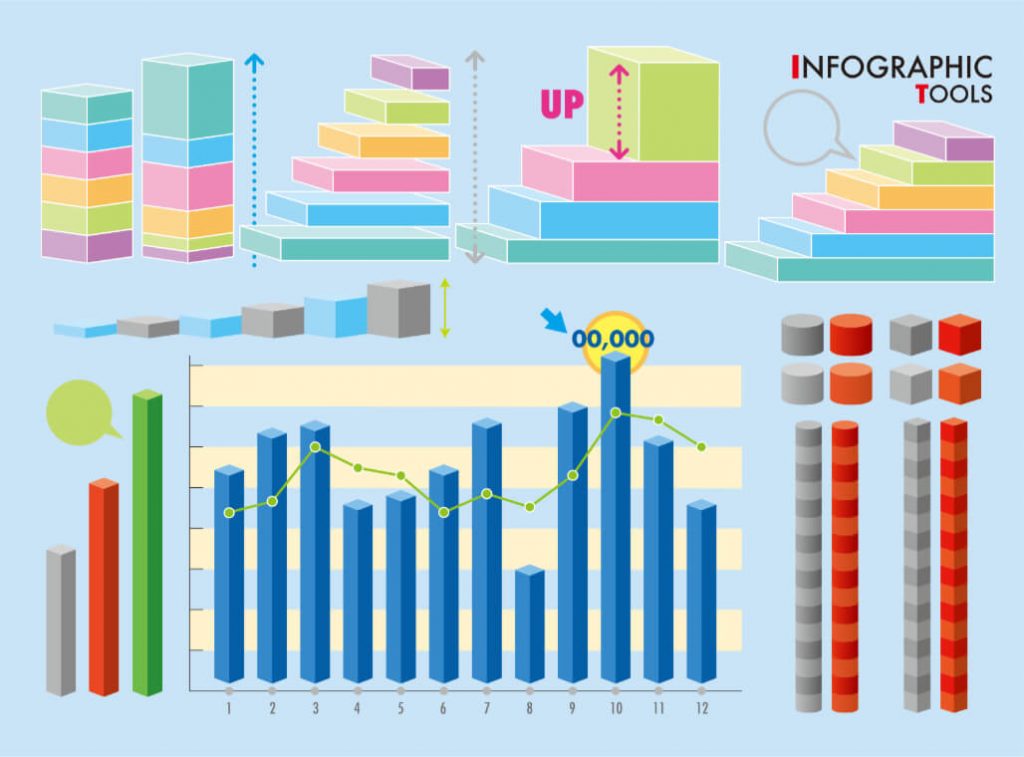
7. Data Visualization Infographic
The next type of infographic that you should know is the data visualization infographic, which is great for creating a case for a perspective, argument, or opinion. It’s also a great option if you want to share a statistic.
Here are some tips to help you create the best data visualization infographic:
Clearly label graphs and charts
Pay attention to the colors you want to use
Use the correct chart or graph to present your data
8. Comparison Infographic
This type of infographic is also known as versus infographic, and this is a common style that people use frequently. It’s a great type of infographic to use if you want to compare pros and cons or show differences or similarities between items.
To create the best comparison infographic, here’s what you should do:
Strategically use colors
Group similar topics together using bubble charts or boxes
9. Flowchart Infographic
With this type of infographic, you can simplify workflow, brainstorm ideas, present solutions, share possible consequences, and visualize the chain of command.
The following tips will help you make your flowchart infographic easy to understand:
Use dots, lines, numbers, or arrows in your flowchart
Start the flowchart from the top left corner of the design
10. Animated Infographic
The last type of infographic on our list is the interactive infographic. This type of infographic is basically a combination of conventional motion and interactive elements used in infographic design. With this type of infographic, you can explore easily and allow your viewers to learn new information.
Here are things to apply for best practices:
Ensure that the interaction is short
Have a goal for your audiences to ensure that they interact with your infographic
Basically, this type of infographic aims to visualize information by using text, imagery, graphs, and other similar elements. It’s worth noting that animated infographics are also known as infographic motion graphics.
Best Infographic Resources to Download Free Infographic Template
With everything we have provided above, you’re now ready to create your own infographic. However, you don’t have to start from scratch. There are different online resources that you can use to create your infographic. What’s more, is that you can download free infographic templates from some of these resources and edit them according to your preference.
1. illustAC
This is a growing platform that boasts more than 700 free infographic vectors and illustrations waiting for you to download. With illustAC, you can search for infographic templates according to their image types, color, license, and more.
2. templateAC
If you’re looking for infographic templates to download for free, you can also consider checking templateAC. This is a platform that has more than 200 free images of infographics, with more being added every day. You can rest assured that you’ll find high-quality infographic templates on this platform.
3. freebieAC
You can also download a free infographic template on freebieAC. All you need to do is signup for a free membership to have access to download these infographic templates. The platform offers different type of infographic illustrations, infographic icons, infographic patterns, and many other infographic templates.
Conclusion
If you’re thinking of creating an infographic, we have highlighted everything you should know in this article, and with the information above, you can create any type of infographic that you want. Among the key things above, including the pros and cons of infographics and how you can create different types of infographics.
We have also highlighted the different types of infographics above, and if you’re looking for where to download an infographic template for free, we recommend checking illustAC, templateAC, or freebieAC without hesitation.