The most popular definition of an infographic is a visual representation of information and facts. An infographic, combining elements of text, image, chart, diagram, and, more recently, video, is a useful tool for presenting facts and explaining complicated situations swiftly and swiftly leading to insight and greater comprehension.
An infographic is:
- A data-rich visualization of a story.
- A tool for education and information.
- A method of increasing brand awareness.
Despite the recent widespread popularity of infographic templates, they have long been employed in newsrooms worldwide under the “umbrella” of Editorial Design. In recent years, various industries have also seen the emergence of data journalism and data storytelling, with the Internet presenting itself as the ideal venue for more complicated data-based narratives and visualizations. An infographic, according to some researchers, is “a type of communication that mixes visual language with text.” Because both languages are complimentary and part of a totality, they cannot be understood separately.
In the last decade, the phrase “infographics” has spread to numerous industries, becoming a strong communication tool for businesses, governments, and educational institutions. There is a whole new group of experts that want to deliver data in a more compelling, intelligent, and engaging manner.
What makes an infographic effective? Infographics can present complex data in a concise and visually appealing manner. When done correctly, they communicate data stories by making information easy to digest, informative, and engaging.
Good infographics must be concentrated, with a clear understanding of who the target audience is and what the main message is. Begin with a strong title. MIT researchers used eye tracking to determine how people perceive information. They discovered that good headlines are crucial to audience retention. They attract your audience, describe the path they are about to go on and spark their interest in learning more. An excellent infographic is similar to a good story. It can guide you through several stages, providing facts and engaging pictures along the way. Numbers, headings, color, white space, photos, and, of course, charts can be used to regulate the flow of your infographic.
Your key focus is to present the info to the audience. This is why you should strive for a good balance of charts and visual elements. While your data may be compatible with a variety of chart types, it is up to you to choose the one that guarantees your message is clear and correct. Always stick to the best charting methods. When designing infographics, keep in mind that simplicity is key. Our best suggestion is to keep it simple unless you know how to develop complicated data representations. You don’t want to make your reader work any harder than needed to understand your work. A crowded image is unpleasant to look at and sometimes diverts attention from the message.
10 Creative Infographic Templates for Free Download
1. Statistical infographics
Do you want to feature the monthly report for your startup? Or would you prefer to draw attention to particular survey data points? The purpose of statistical infographics is to highlight data. To help the viewer in understanding the facts given, this kind of infographic uses graphs, charts, and data visualization tools. Statistical infographic templates help utilize infographics to share insightful statistics and information and assemble detailed information.

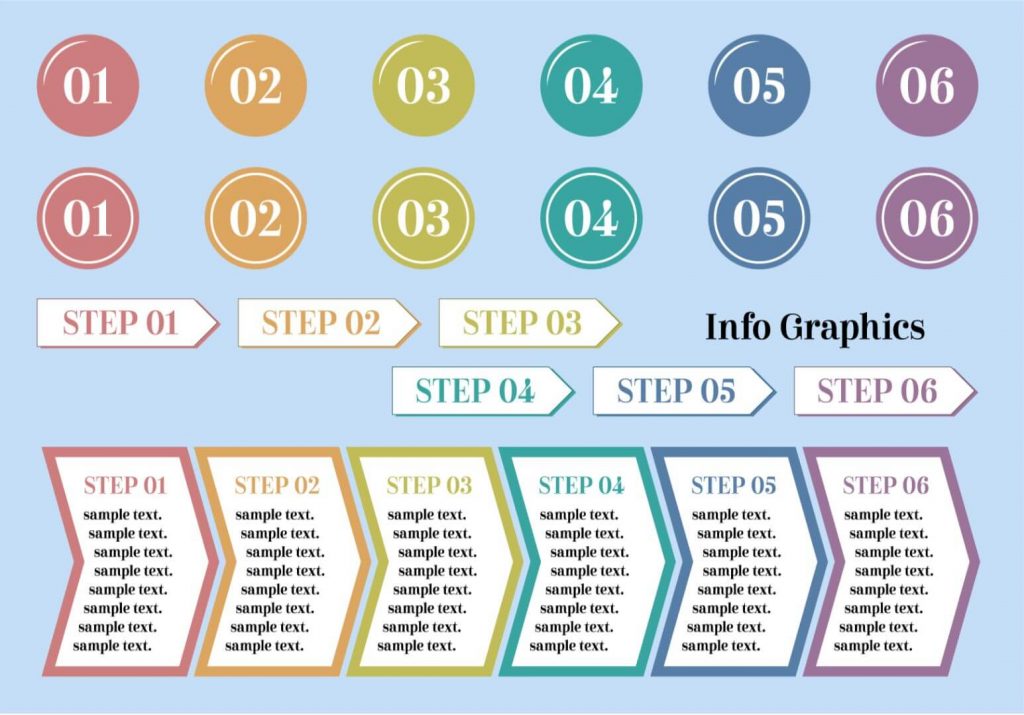
2. Process infographics
Choose process infographics if you want to show the different steps in a process. A process infographic may help your audience visualize the method and the results, whether you’re sharing family recipes or explaining them to job candidates. Process infographics can be used to break down a complicated procedure into manageable, straightforward steps.
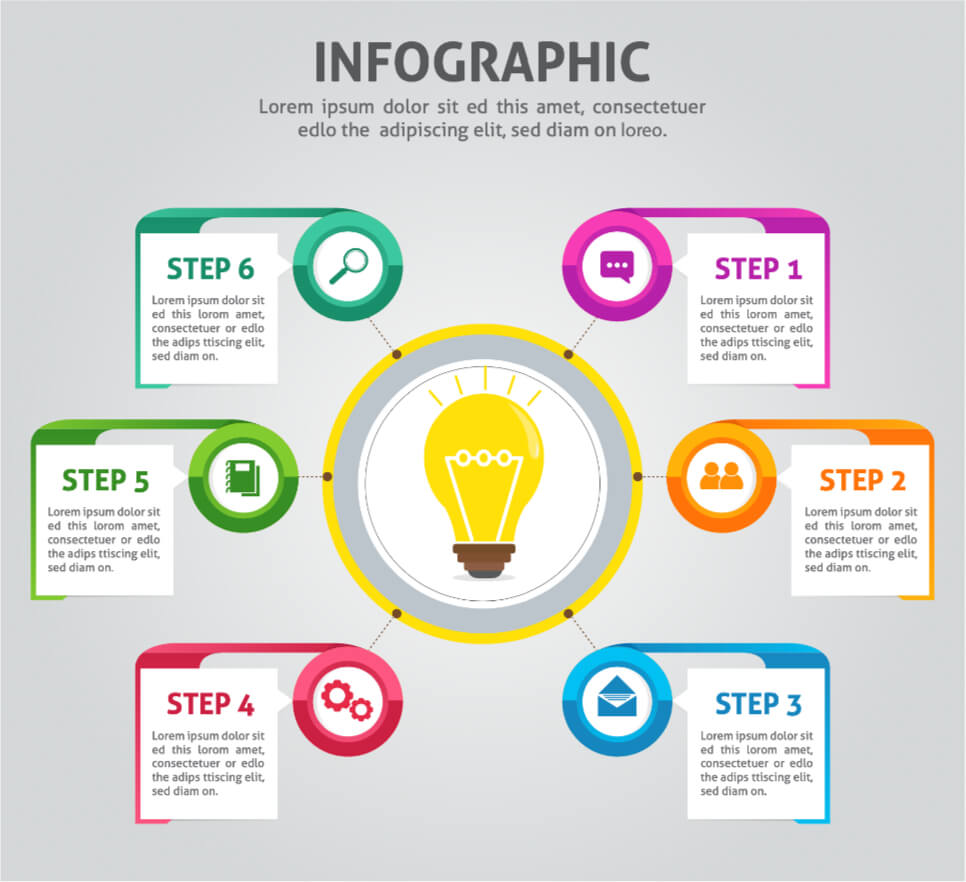
3. Informational infographics
Informational infographics emphasize texts and words rather than numbers and figures. It is more generalized and can include information on any subject. The text in this kind of infographic is more prominent than the graphics. Using informational infographics to explain topics or concepts by pairing words with engaging visuals together and combining descriptive language with compelling images, can clarify ideas or concepts.

4. Timeline infographics
In chronological order, timeline infographics display events, actions, or time-related data. For this kind of information, formats like horizontal, vertical, or winding might be used. Infographics about time can be used to illustrate history or show how long something will take and it also shows the development of a place, event, or concept over time.
5. List infographics
Listicles are popular all over the internet! Your audience will adore you more if you use list infographics because the list format immediately captures their attention and helps them remember information. To make each item or example stand out, icons and graphics can also be used in place of bullet points and statistics. List infographics can be used to make a simple list pop out and attract the attention of your viewers.
6. Comparison infographics
A comparison infographic contrasts or compares two possibilities, concepts, or ideas. This infographic format makes it easier for viewers to compare and contrast two or more options. It’s perfect for giving the two sides of the narrative. Use comparison infographics to assist your audience in making educated decisions, whether you’re contrasting two products or highlighting the advantages and disadvantages of traditional vs. digital marketing. Use comparison infographics to display the contrasts and similarities and describe how one choice is better or worse than the other.

7. Resume infographics
Infographic resumes, sometimes referred to as visual resumes, are visual CVs that enable job seekers in standing out from the competition. An infographic CV uses eye-catching colors, graphs, icons, and pictures to highlight your excellent skills, career history, and educational background. The nice thing about infographic resumes is that you can highlight your accomplishments and skills without overwhelming the reader with too much information. Use comparison infographics to get hiring managers and recruiters interested in you so they will call you back for an interview.
8. Multipurpose Infographic Templates
Since infographics can cover a wide range of topics, you usually require a template that can be used repeatedly. A template that is flexible enough to be readily customized for various topics and themes, especially if you intend to produce several infographics is likely to be most helpful. In this blog, we’ve collected simple vector infographic templates with stylish designs that are simple to customize with vector applications and are available for immediate download.
9. Business Infographic
These templates are appropriate for infographics in a variety of industries, including startups, web and digital, marketing, finance, and more. All of these free templates may also be readily modified to implement your company’s infographic concepts because they are fully editable in vector software.
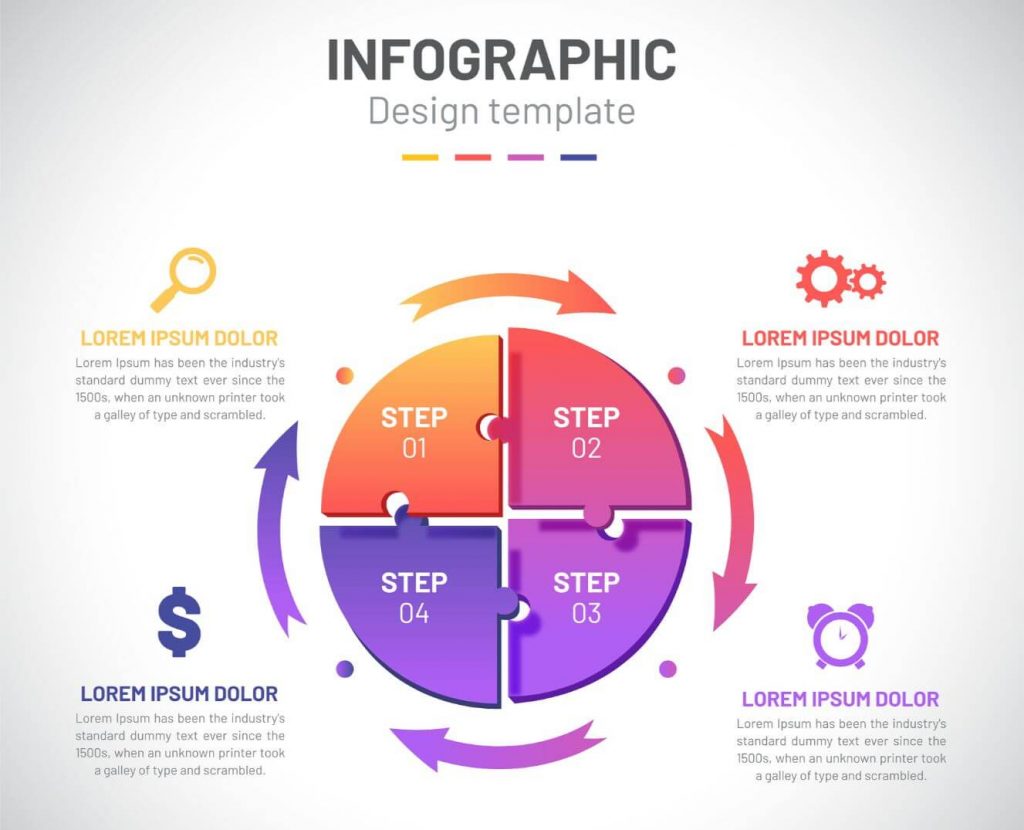
10. 3D Infographic Templates
Infographics are becoming highly popular in all fields of graphic design, particularly the 3D effect. This collection of 3D vector infographic templates includes designs that are multifunctional and can be customized for practically any infographic topic. The attention-grabbing 3D design style in this example is presented in the form of free, fully editable vector infographic templates.
Why Infographics Should be Used?
One of the main reasons infographics are so popular for conveying information is their versatility. You can include an infographic in a blog post, utilize it in social media, or send it directly via email. Best of all, the visual nature of graphics makes it an excellent starting point for attracting the attention of your target audience. Here are six examples of why to use infographic templates in your digital work, school, or in business:
1. Keep your team on track by visualizing key metrics and data.
Data-heavy content can be difficult for some team members to grasp at work. Infographic templates allow you to create and share simple visualizations with your team. Make your numbers and stats stand out using illustAC’s infographic templates, which include the appropriate colors, icons, and images.
2. Simplify communication and clarify messages.
It can be difficult to explain new concepts. The good news is that infographics can help in simplifying and demystifying complicated concepts. When done correctly, infographic templates help in understanding the key idea in a single glance.
3. Get complex information across in the classroom.
From understanding the impact of climate change to learning new vocabulary, enrich classroom lessons with visual aids. A short survey of undergraduate students revealed that they prefer infographics over text-based information.
Whether it’s a virtual or face-to-face lesson, employing infographics in the classroom has the following advantages for students:
- Encourages students to think critically
- Encourages students to consider many points of view
- Help students in improving their information-gathering abilities and research skills
- Strengthens memory retention
Meanwhile, infographic activities benefit teachers through the following:
- Save time on lesson preparation.
- Be more versatile in their instructional strategies
4. Make people aware of an issue.
With 65 percent of the world’s population being visual learners, visual communication tools such as infographics are perfect for raising awareness about a problem. Whether you want to educate your coworkers about internet privacy or raise awareness about biodiversity loss, relevant infographic templates can help. A well-designed infographic on your website can also assist you in increasing backlinks and website traffic.
5. Explain the procedures.
If you rely entirely on paragraphs of text to explain a procedure, it can be time-consuming and boring. You may use infographic templates to add visuals, photos, and icons to make learning more memorable and enjoyable for your audience. Use an illustAC infographic template instead of typing away in a Google Doc the next time you need to create a tutorial or a quick workflow.
6. Compare two concepts or products.
Use infographic templates to show the similarities and differences between two conflicting ideas to help your audience make smarter judgments. You can compare products, people, eras, ideas, pets, and so on. The options are limitless!
A decent comparison infographic will make your job easier, whether you’re a marketer who wants to explain how your product is superior to the competition or an educator discussing the advantages and pros and cons of GMOs in class.
Download and Use Worry-Free
If you want to use our resources in products for sale, you must ensure that these are not the main elements of the design. For example, you cannot sell t-shirts, mugs, vinyl, calendars, etcetera, if these have an image from our sites as the main element of the design. This means that you must use your own designs or third-party designs to create the main elements of the composition and use images on our sites as backgrounds or secondary elements. If multiple images on our sites are used to create the design, these will all be considered main elements, as they all belong to our sites.
Please be aware that this rule applies to both free and premium users.
Conclusion
Once you’ve found your ideal infographic template, you can download and personalize it by changing the text, symbols, colors, and fonts. All of this process is made easy for you as all the infographic templates on illustAC are created in vector format and easily editable.